On Monday, October 4th US stocks finished the day down by more than one percent. The market was officially off its highs by more than any other point in 2021. Headlines in the financial press used terms like “battered” and investor hand wringing began. How far down from the all-time high do you think the index was on that day? 10%? 15%? Guess again. The answer is 5.5%. FIVE AND A HALF PERCENT off the highest point the market has ever traded. As this is being written, the decline has narrowed to ~2% and the market has returned over 18% thus far in 2021.
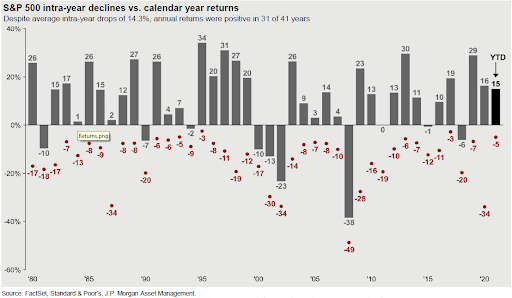
Volatility is a normal part of investing in equities. The chart above is one of our favorites. It shows the calendar year returns for the S&P 500 index going back to 1980. The red dot shows how far the market fell at its worst point during a given year. On average the market will fall ~14% in any given calendar year from peak to trough, so a 5-6% decline is nothing remarkable. Of course, this won’t stop pundits from speculating that more pain is to come. For now, we aren’t concerned with a 5% or 10% drawdown. In fact, as long-term investors we look for regular volatility so that we may add to names and sectors of the market at more attractive prices.